A stock market investor’s activity is supported by various elements, but Stock Market Technical Analysis is unquestionably the most important. Because it is limited to visual inspection of charts, this is the simplest way of learning to evaluate the stock market. However, it is frequently the strategy that produces the finest results.
Stock Market Technical analysis is the study of historical market data such as volume and price. Technical analysts use market dynamics, behavioural economics, and statistical research to assess prior performance in order to predict future market behaviour.
In this stock market technical analysis guide, we will describe what stock market technical analysis is, as well as its main principles and methods. This tutorial will, of course, provide instruction on how to use various stock market technical analysis approaches so that you can immediately engage in the stock market.

What is Stock Market Technical Analysis?
In the late 1800s, Charles Dow and his Theory established technical analysis as we know it today. The stock exchange Technical analysis methods are used to examine how variations in price, volume, and implied volatility are affected by supply and demand for securities. It is based on the concept that when combined with suitable investing or trading criteria, past trading activity and price fluctuations of security can be useful indications of the security’s future price movements.
It’s commonly used to develop short-term trading signals from various charting tools, but it may also aid with assessing a security’s strength or weakness in relation to the larger market or one of its sectors. This data aids analysts in enhancing their total valuation estimate.
Basics of Stock Market Technical Analysis
Dow Theory set the groundwork for what would become the current technical analysis. The Dow Theory was not explained in its entirety. Rather, it’s a collection of Charles Dow’s writings throughout the course of several years. Dow proposes a number of principles, three of which are:
All information is included in the prices
This theory is connected to the strong and semi-strong variants of market economy. According to technical analysts, the current price accurately reflects all facts. Because the price already reflects all of the information, it represents the fair value and should be used as the basis for the study. After all, the market price reflects the sum of all players’ knowledge, which includes traders, investors, portfolio managers, buy-side experts, sell-side experts, market strategists, technical analysts, fundamental analysts, and others. It would be insane to disagree with the price set by such a powerful group of individuals. Technical analysis interprets what the market is saying using the information recorded by the price in order to generate a forecast for the future.
Price changes aren’t entirely random
The majority of technicians agree that prices fluctuate. Most technicians, on the other hand, are aware that prices do not always follow a trend. It would be incredibly difficult to profit from technical analysis if prices were always unpredictable.
A technical analyst believes that by identifying a trend, investing in the stock market, or trading according to the trend, and profiting as the trend develops, he or she may make money. Technical analysis can be used to spot both short-term and long-term trends because it can be applied to a variety of time horizons.
The “what” takes priority over the “why”
The price is the end result of the conflict among supply and demand for the firm’s shares. The goal of the analysis is to predict the price direction in the future. Technical analysis is an easy method because it focuses solely on pricing. Fundamentalists want to know why the price is so high. The “why” element of the equation is too broad for technicians, and the underlying justifications presented are frequently questionable. Technicians believe it is more important to concentrate on the what rather than the why. What is the cause of the price hike? Simply put, there were more purchasers (demand) than sellers (supply).
Key Factors of Stock Market Technical Analysis
Technical analysis is used to analyze assets whose price is only driven by supply and demand dynamics. When other forces can impact the price of a security, the technical analysis fails. Technical analysis makes two crucial criteria about the stocks being analyzed in order to be successful:
High liquidity
Volume is the fundamental of liquidity. Investors can invest fast and easily in highly liquid, high-volume equities without having a significant impact on the stock price. Because there are fewer buyers and sellers, illiquid stocks are more difficult to trade, and buyers and sellers could have a decisive impact on the price, distorting technical analysis. Furthermore, illiquid equities can have very low values, making them more susceptible to manipulation by individual investors. Because of these external variables, thinly traded equities are unsuited for technical analysis.
No extreme news
Extreme events, such as the untimely death of a company’s CEO or political events such as terrorism, are beyond the scope of technical study. When the price is influenced by “extreme news” pressures, technicians should be calm and wait for the chart to stabilize and begin to represent the “new normal” that arises from the news.
Categories of Stock Market Technical Analysis
Stock market technical analysis can be separated into two categories. The most well-known is chart analysis, which focuses solely on graphs and includes sketching tools to emphasize key patterns and thresholds. The examination of indicators is also part of technical analysis. These are alternative charts created by restating price movements mathematically. They are often located beneath the main chart and might provide buy and sell trading tips.
We’ll explain to you the three strategies of both categories in this segment of the stock market technical analysis guide. You’ll have a total of eight different techniques at your disposal, which is more than enough to do an appropriate stock market technical analysis.
Stock Market Chart Analysis
The most basic type of technical analysis is chart analysis of the stock market. It is, after all, a purely visual strategy. It entails using well-defined criteria to draw straight lines and segments on graphs in order to emphasize what are known as certain graphical designs. These signals can be used to detect critical levels, highlight trends or trend reversals, and, consequently, make trades. Below we will walk you through three of the most widely used chart analysis tools.
1. Supports and Resistors
One of the most widely used technical analysis strategies in the stock market is the use of supports and resistances. This is a rapid way of determining three points of interest for a trader: market direction, market entrance timing, and market exiting points (stop and limit).
Support
On a chart, support is a level below which the price has fallen but has been unable to breakthrough. The chart below demonstrates how the price falls to the support zone and then dramatically rises from there.
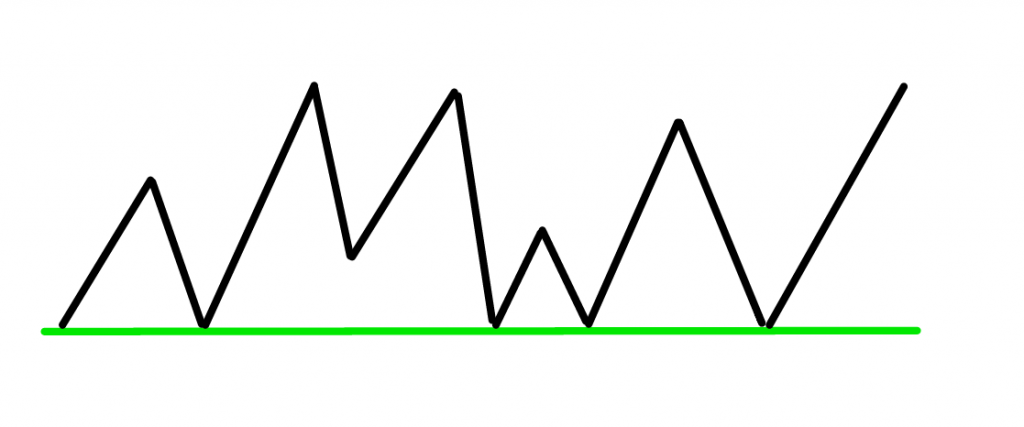
Support, in theory, is the price level where demand (purchasing power) is strong enough to keep the price from falling further. The logic goes like this: as the price approaches to support and becomes lower, customers see a better deal and are more likely to purchase. Because they are getting a worse deal, sellers are less willing to sell. In this case, demand will outnumber supply, keeping the price from falling below support.
Resistance
On a chart, resistance is a level that the price has reached but failed to breakthrough. The chart below illustrates how the price rises to the resistance zone and then “bounces” violently away from it.

The price level at which the offer (selling power) is strong enough to prevent the price from rising further is known as resistance. This theory holds that when price approaches resistance and gets more expensive, sellers will be more willing to sell and buyers will be less likely to buy. In this case, the supply (sellers) will outnumber the demand (buyers), preventing the price from breaking over the resistance level.
2. Trend Channels
Trend channels are yet another tool in technical analysis that may be utilized to find attractive buy and sell opportunities. Two parallel lines framing the price motion on the charts highlight them.
The top trendline indicates resistance, whereas the lower trendline indicates support. As a result, the channels’ tops and bottoms suggest potential places of support or resistance.
Bullish movement channels have a positive slope (up), while bearish movement channels have a negative slope (down) (up). Horizontal channels are devoid of information.
The definition is the same for all sorts of channels: This can be utilized as a buy zone when prices reach the bottom boundary. This can be utilized as a sale zone when prices hit the upper bound.
3. Symmetric Triangle
Triangles are trading patterns that are horizontal in nature. The triangle is at its widest point at the start of its development. The trading range narrows as the market continues to move sideways, and the triangle’s point forms. The triangle, in its most basic form, depicts a lack of interest in an issue on both the buying and selling sides: the supply line is shrinking to meet demand.
The bottom triangle line, also known as the lower trendline, is a demand line that signals chart stability.
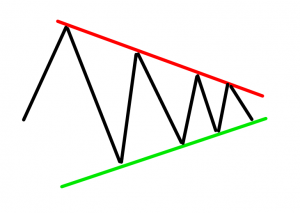
Symmetrical triangles are generally continuing patterns that emerge in markets that are largely directionless. The highs and lows appear to come together at the point of the triangle during this period of indecision, with no major volume. Investors are simply unsure of which side to take.
When investors finally decide which way to go, they do so with a lot more volume than they did in the days and/or weeks leading up to the breakout. Typically, the breakthrough occurs in the direction of the current trend.
To put it another way, a trader who sees a triangle must wait for prices to break out of the triangle before buying (if prices come out from above) or selling (if prices come out from below) (if prices come out from below).
Technical Indicators in the Stock Market
Another prominent strategy of stock market technical analysis is the use of technical indicators. These are mathematical reinterpretations of price movement. This reprocessing frequently results in the production of one or more oscillator curves (s). Most of the time, these secondary curves are positioned beneath the graphs. Although some indicators are very comparable, each technical indicator is unique and has its own meaning. We use technical indicators to get buy and sell signals so we may know exactly when to take a position on an action. Three significant technical indications are discussed below:
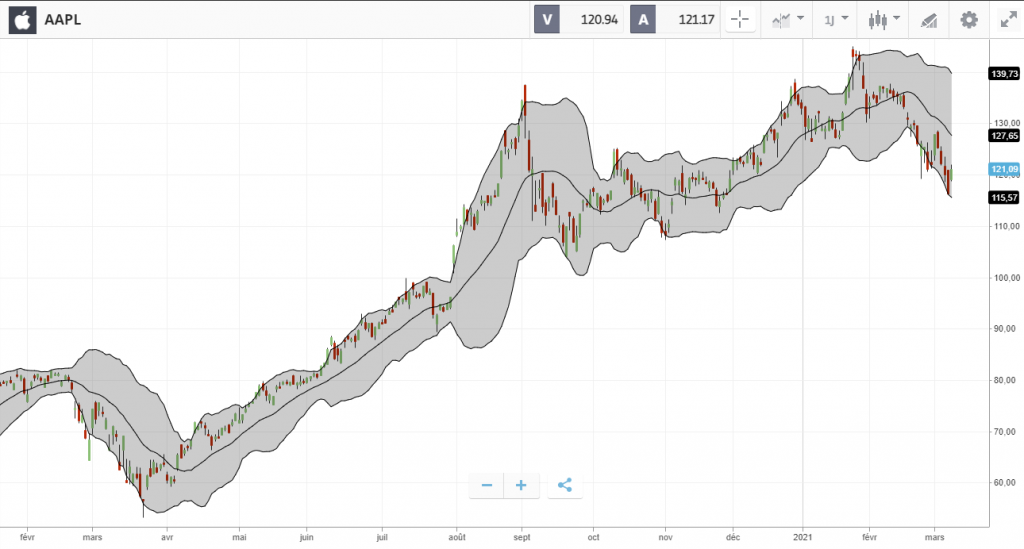
1. Bollinger Bands
Bollinger bands establish probable support and resistance zones using a mathematical concept known as standard deviation.
Lines above and under a central price axis make up a volatility channel. These lines, also known as bands, move closer or further apart based on the level of volatility in a market. Bollinger bands are used to measure market volatility and provide a wealth of information, such as:
- Continuation or reversal of the trend
- Market consolidation periods
- Breakouts in significant volatility are on the way
- Potential market highs and lows, as well as price targets
Bollinger Bands are made up of three bands that rotate around a centered simple moving average (SMA) with a default value of 20, as well as two additional bands. The following is how the interpretation is done:
- Lower band: It emphasizes a statistically high or pricey level.
- Upper band: It emphasizes a statistically low or inexpensive level.
- The gap between the lower and upper bands: It emphasizes the market’s turbulence (the bigger the gap, the greater the volatility)
Finally, it is advisable to sell when prices are approaching the upper limit. When prices are towards the lower band, on the other hand, it is better to buy.
2. Volume
The term Volume refers to the number of contracts traded in a specific period of time, typically on a daily basis. Volume analysis is used by almost every analyst who tracks securities in the financial markets.
Volume trends must be understood and discerned by technical analysts. Not least because data for an entire market’s trading volume, as opposed to the trading volume of single participation, can signify various things in the market.
Volume analysis may be used to discover many trends in the financial markets. Some of these trends are:
- Trend confirmation: When a price movement is followed by increased volumes.
- Price Reversals: When volume in an uptrend progressively falls, it suggests that the trend may be turning down, and vice versa.
3. Commodity Channel Index
The CCI technical indicator is a type of oscillator that shows when an asset is overbought or oversold. It aids in the identification of asset price peaks and troughs, as well as the weakening or end of a trend and a change in direction.
This means you can theoretically enter a trade when a trend starts or exit a transaction before it turns against you.
CCI is typically displayed on graphs as a moving average-like line that smooths out the data. It is calculated to generate a reading that moves in a channel between +100 and -100 for the majority of the time.
A rating of more than +100 may signal that an asset has been overbought, implying that the price is about to fall. A reading of less than -100 implies that an asset has been oversold and that the price may be rising.
When the CCI indicates overbought conditions, traders will attempt to sell – entering when the indicator crosses the +100 down. When the CCI suggests oversold circumstances, they will look to buy. That is when the indicator crosses the -100 threshold and begins to rise.
How to make a trading decision with Technical Analysis?
The ultimate objective of technical analysis in the stock market is to make effective trading decisions and make money. This procedure, however, can be broken down into multiple steps. And specific technical analysis methodologies are appropriate at each of these stages. In this section, we’ll go over the many stages of a trading decision and offer the best approaches for each of them.
Step 1: Examine the Stock Market Trend
Of course, the first step in making a trading decision is to look at the trend on a chart that is longer than your trading chart. You can use daily charts to assess the overall trend if you practice stock market trading on hourly charts, for example. You will study the trend on 1-hour charts if you are trading shorter-term on 5-minute charts. It’s about stepping back to see the market’s trajectory beyond your charts’ time horizon.
The most appropriate method for conducting this trend analysis is graphical analysis. The trend channels described in this guide can be used to identify positive, negative, or neutral trends.
This enables you to choose in which direction you should position yourself in the short term, as we shall discuss in the next phase.
Step 2: Get Trading Signals
Once you’ve decided which way to go, you’ll need to figure out when the optimal moment is to buy or sell. Technical indicators will be the most appropriate tools for this.
It’s worth noting that multiplying the indicators utilized can be counterproductive, as some can contradict each other, and it’s rare for all of them to show the same thing at the same time if you use five or six.
Using a single indicator, on the other hand, eliminates the potential of receiving confirmations. In general, there shouldn’t be too many or too few indicators used. The best number, in our opinion, is two. In this instance, you can only take positions if the two indicators offer the same signal, or at the very least, if they do not contradict one another.
Step 3: Choose Stops and Limits
Finally, once you’ve decided which way to position yourself and discovered the exact perfect time (or price) to buy or sell, you’ll need to decide on a stop and a limit.
Many tools, including the supports and resistances discussed in this tutorial, can be utilized to do this. Other strategies, like pivot points or Fibonacci retracements and their different versions, are also worth investigating.
The fundamental concept is to determine critical levels that will serve as goals or invalidation points.
How to start trading with Stock Market Technical Analysis?
Several steps must be completed to begin stock market technical analysis. Each step is detailedly explained below:
Step 1: Choose a Stock Broker

The very first step is to choose an online broker, and we have chosen eToro as our favorite and most recommended broker to complete this step. This broker was founded in 2007, thus it has a long history, which is a sign of trustworthiness. Millions of people use eToro in dozens of countries. It’s also worth noting that, in addition to stocks, eToro allows you to trade a variety of other assets, including currencies, commodities, and exchange-traded funds (ETFs).
Aside from its extremely user-friendly stock market technical analysis program, eToro also has one of the greatest social tradings and copy trading systems. You can search, classify, and select the top traders to automatically repeat their trading decisions in real-time.
Returning to the stock market and shares, it’s worth noting that eToro is the only broker that lets you buy stocks in CFDs or cash. You will not benefit from leverage if you invest in cash, but you will receive dividends. Leverage will be used in CFDs, but you will not be eligible for dividends.
When it comes to expenses, it’s difficult to top eToro because the broker doesn’t charge a commission for buying or selling stocks.
eToro is also incredibly secure, as it is controlled by three different authorities: CySec in Cyprus, FCA in the United Kingdom, and ASIC in Australia.
eToro’s Free Stock Market Technical Analysis feature
When it comes to the stock market technical analysis platform, new traders frequently praise how simple it is to use. eToro has all of the tools that expert traders require to conduct complicated technical analyses.
All of the traditional drawing tools are available, including those for tracing supports, resistances, lines, and even trend channels. Many indicators, covering the most well-known, including the RSI or the MACD, as well as more contemporary indicators, can be added to the chart. Indeed, the eToro technical analysis platform is continually updated to ensure that you have access to the most up-to-date technical analysis techniques.
The platform also comes in a “Prochart” edition, which includes pre-built setups such as templates for partitioning the screen into many sections to monitor multiple actions or time horizons at the same time.
Finally, eToro’s platform is also available as a stock market application, which allows you to conduct technical analysis from anywhere.
Step 2: Registration
The second step requires you to complete a registration form by providing basic personal information. Choose a password for the eToro trading site that will be required for identification.

You must agree to the terms and conditions as well as the privacy policy after completing the form. To do so, simply check the appropriate boxes. When you select “Create an account,” the first step is completed.
Step 3: Verification
The second step entails account verification. Other personal information, such as proof of your identity and proof of address, will be requested. A KYC (Know Your Customer) survey will also be given to you. This section includes questions on your investment goals, trading experience, and financial situation.

Step 4: Deposit Funds
You will be eligible to deposit funds into your account once the account verification procedure is completed. The simplest method is to use a bank card, which provides immediate access to monies. Begin by going to the bottom left of the eToro platform and hitting the “deposit funds” button.
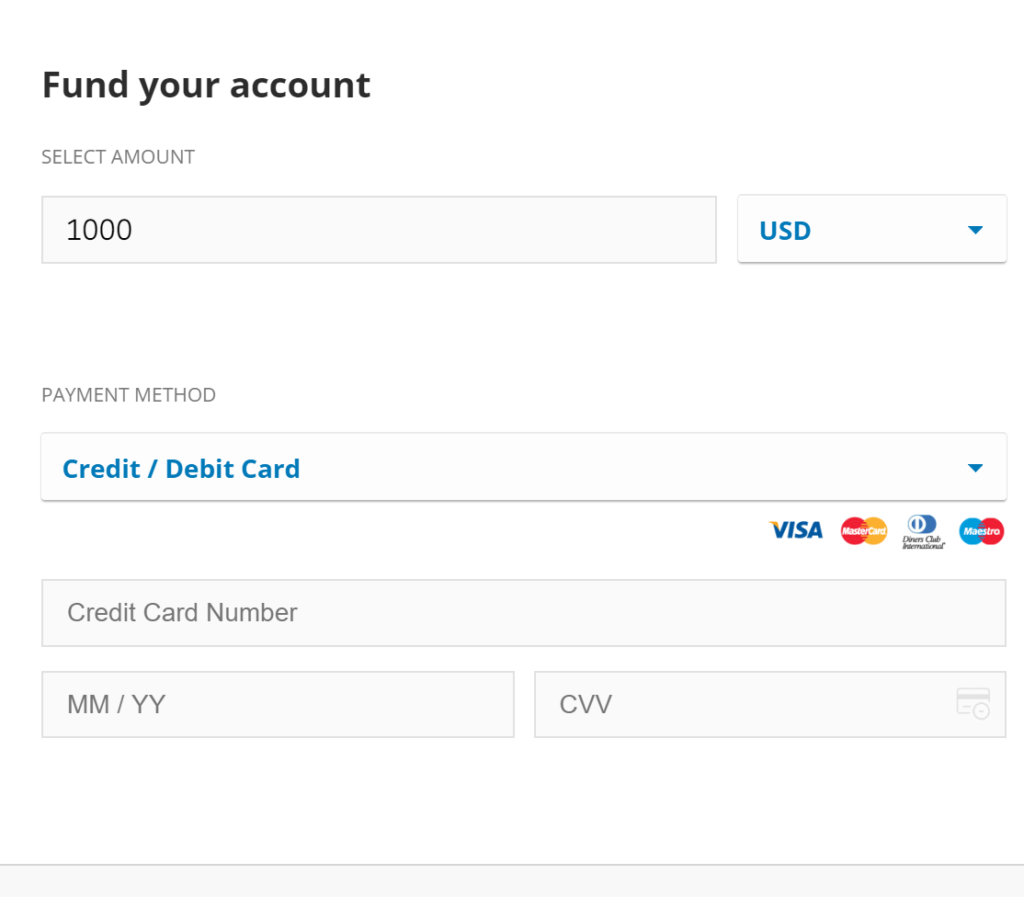
After inputting the amount to be invested and verifying the currency to be used, choose a payment option. It will also be important to supply the information required for payment validation at this time.
Step 5: Start Using the Stock Market Technical Analysis feature
Click “Markets” in the left column, then “Stocks” at the top of the platform to see the list of stocks available on the eToro trading platform. A list of all available stocks at eToro will emerge.
You can also browse a list of stock market indexes if you want to do some technical analysis on the FTSE100 stock market, for example.
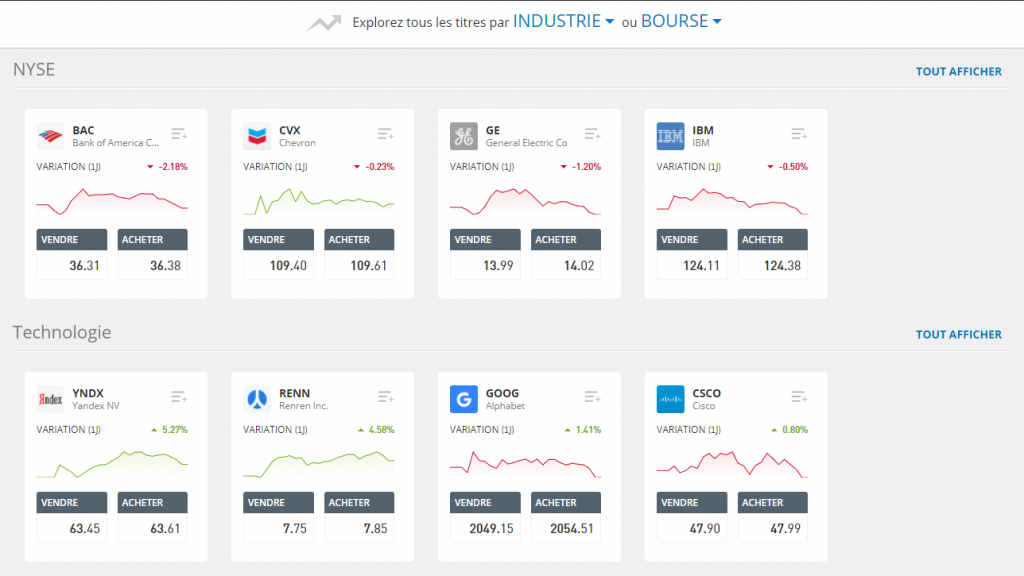
Interestingly, each item on the list has a small chart, which is highly useful for spotting equities at a glance for further investigation.
When you already know which stock you want to analyze, simply type its name into the search area at the top of the eToro site, as illustrated below with the example of Apple stock. The same may be said for a technical stock market study of the CAC 40.
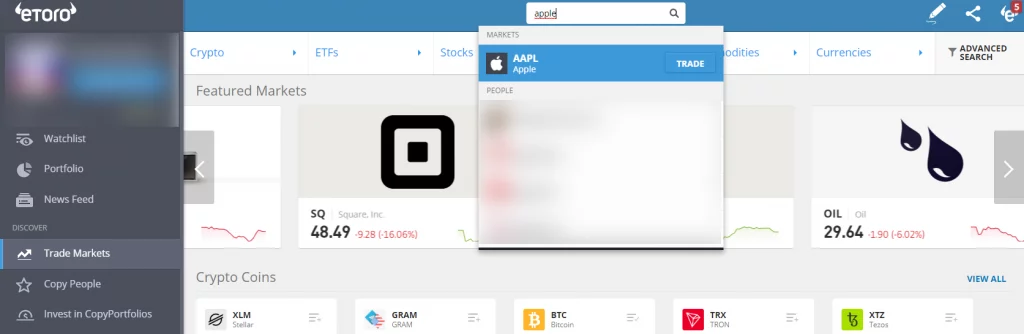
Then all you have to do is click on the action’s name to go to its file. Then, within this file, select the “graph” tab. This will allow you to see the chart on which your stock market technical analysis will be performed.
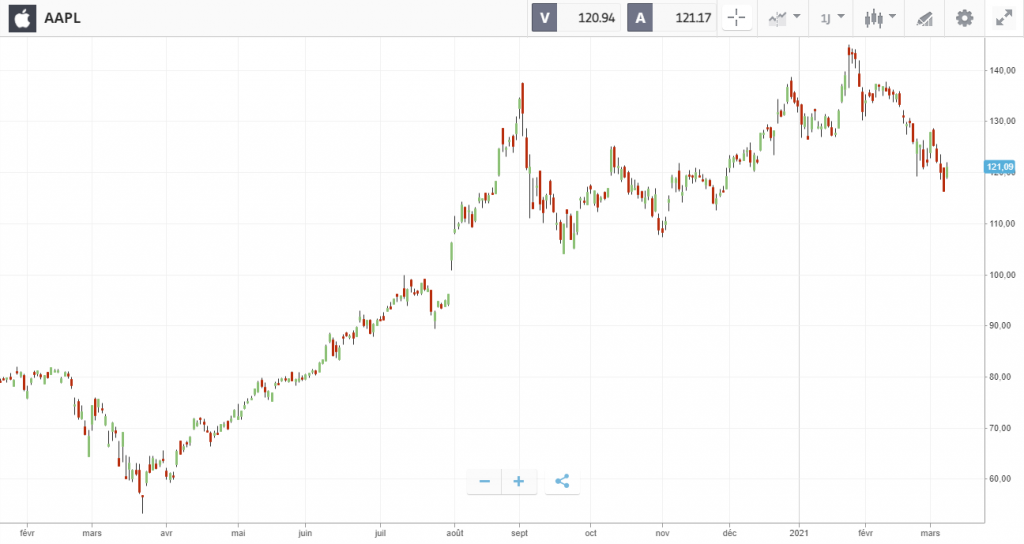
Click on the grey pen symbol at the top of the chart, to the left of the cogwheel symbol, to access the indicators and drawing and plotting tools to add to the chart.
You’ll be able to access the menu of technical indicators and drawing tools by doing so.
Choose the Bollinger Bands indicator from the “Studies I” section, for example. To open the indicator’s settings and validation window, click on it, as shown below:
To add the indicator to the chart that is the subject of your stock market technical analysis, click “make,” as shown below:
Step 6: Configure and Validate the Order
When you’ve finished your analysis and are ready to trade, go to the top of the technical chart and click on the bid or ask price, depending on the direction of the desired transaction. This will bring up the window shown below, where you may place your order.
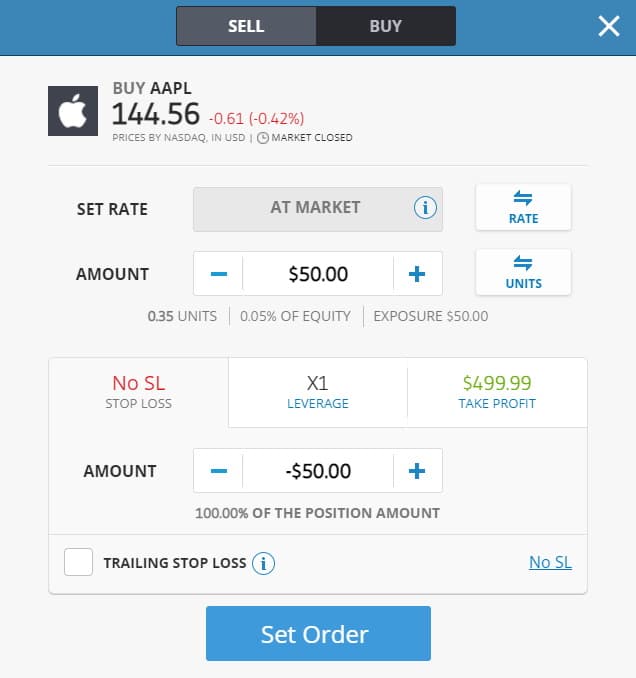
Before verifying the trade order, it will be necessary to set a number of critical factors, including leverage, stop-loss, and limit orders.
Then, by selecting “Set Order,” you can validate the stock market order and transmit it to the market in real-time. The evolution of your position can then be tracked live on the eToro stock market technical analysis site.
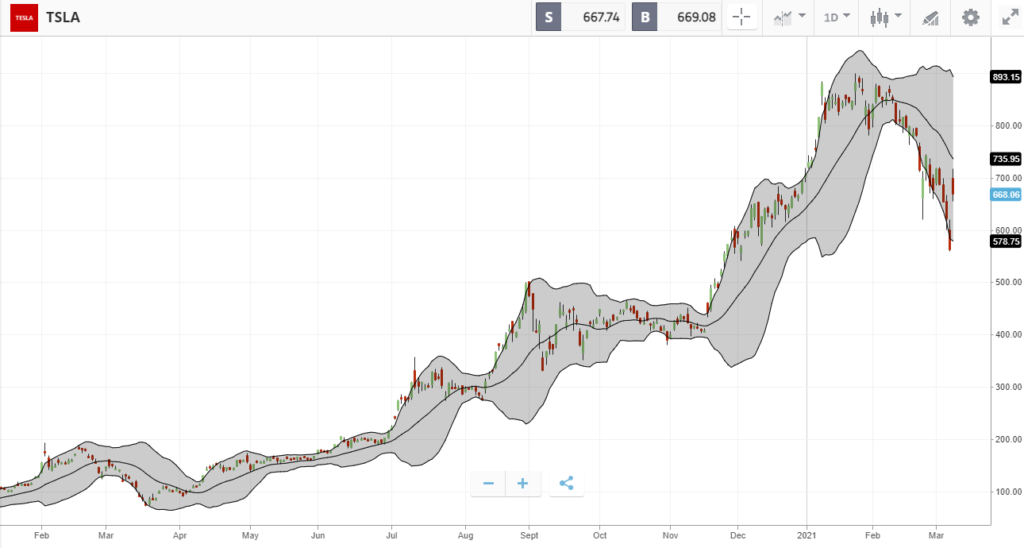
A Clear Example of Stock Market Technical Analysis
This section will provide you with a technical analysis of Tesla’s stock, from which we will draw various conclusions. This will help you understand what technical analysis in the stock market is and how to evaluate a chart step by step to make a solid trading decision.
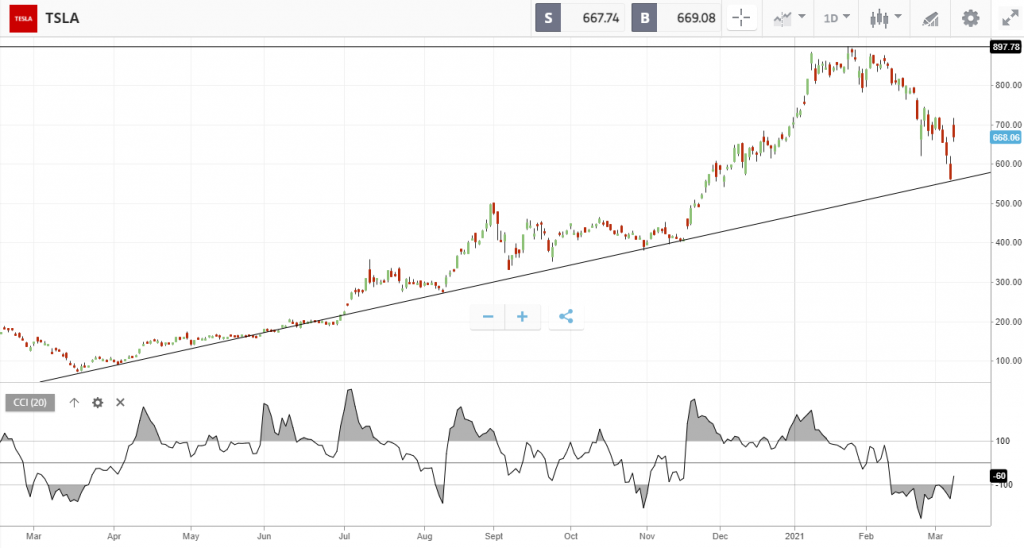
On this daily chart of Tesla stock, a rising trend line can easily be seen, on which the stock price has rebounded multiple times in the last year, including most recently after a dip. The significance of this line cannot be overstated, and as it has not been broken, we may conclude that the Tesla stock trend remains bullish.
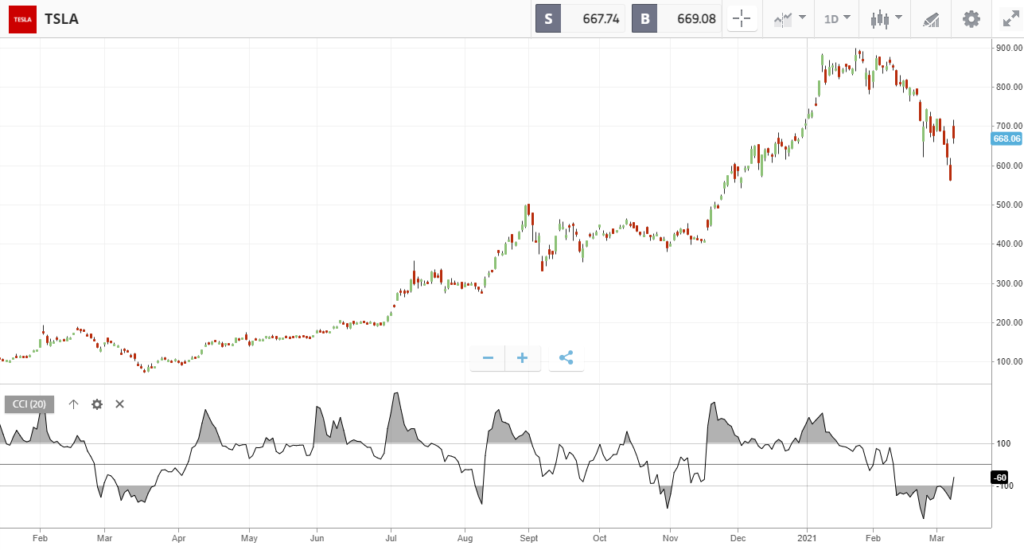
After trading in oversold territory for a few days, the CCI indicator is rising above the -100 level, indicating a buy signal. As a result, it could be an excellent moment to invest in Tesla.
Finally, we’ll keep an eye on the historic high of $900 as a goal for this long position. Historical highs should be seen as potential resistance or even trend reversal points by default. The stop should be set just below the current location of the aforementioned trend line, which is about $550.
Pros and Cons of Stock Market Technical Analysis?
As this guide comes to an end, it’s worthwhile to note the pros of stock market technical analysis that we’ve just discussed, as well as the strategy’s few cons:
Pros
Learning is simple and quick
Stock market technical analysis necessitates a thorough understanding of financial analysis and economics in order to examine company balance sheets and income statements, as well as to determine the future commercial potential of their operations. It is a distinct career that necessitates the completion of proper coursework. Technical analysis, on the other hand, is a relatively simple and quick to master discipline. Despite the fact that there are hundreds of distinct technical analysis approaches, no trader is familiar with all of them. This is for the simple and valid reason that it is ineffective.
Research has shown that it is preferable to limit oneself to a few well-mastered approaches rather than trying to learn everything, which leads to confusion. One or two weeks of study and watching videos should be enough to teach you the fundamentals of stock market technical analysis. Then you’ll have to practice on your own to understand how to put these lessons into practice effectively. Overall, even if you’re completely new to trading, the stock market technical analysis could have you ready to trade in less than a month. In the end, stock market technical analysis can help you become a trader very quickly.
Allows you to assess equities more quickly than you could use basic analysis
Technical analysis is not only easier to learn but also to apply than fundamental analysis. As a result, trading decisions become more responsive. Because the charts are continually changing, a technical analyst’s view of the companies he follows is updated in real-time. To revise his opinion, a fundamental analyst must wait for results or other press releases to be released. As a result, he is unable to change his viewpoint in real-time.
Increases success rate
Although it may seem obvious, the major reason traders employ technical market analysis is because trading decisions based on technical market analysis components perform significantly better statistically than positions established at random or using other approaches. It should be mentioned, however, that technical analysis of the stock market can never provide you with 100% assurance. As a result, it’s understandable if a properly executed technical stock market study does not always produce the desired outcome. You can consider it a success if your stock market technical analyses work two out of every three times.
Helps to build trading strategies and plans
Finally, as we discussed in the previous part, technical analysis of the stock market is the foundation of trading strategies. Trading plans and procedures are built on the foundation of chart analysis techniques and indicators. At each stage of a trading decision, the preferred approaches are listed. Finally, utilizing only a few stock market technical analysis principles, it is easy to construct a complete trading technique from A to Z.
Cons
Risk of never beginning
Technical analysis of the stock market can be done in a variety of ways, as we’ve already discussed. It’s tempting to imagine that mastering technical analysis necessitates mastering all of these methods. However, this will simply cause you to be perplexed. You’ll be encouraged to utilize a different indicator for each study, so you won’t get proficiency in a few specific signs. It is preferable to learn little but well. Above all, it is critical to swiftly put the teachings into practice in order to gain expertise as quickly as possible.
Risk of over-analyzing
Similarly, when we have access to a large number of indicators, we may be tempted to employ as many as possible in each analysis, which is a significant mistake. Indeed, the indications are not always accurate and, as a result, they can occasionally contradict one another. It will be highly rare for all four or five indicators to indicate the same signal at the same time if you use four or five indications. As a result, you will practically never succeed in any operation.
Impact of artificial pricing differences
Artificial price movements are most commonly “caused” through splits, dividends, and distributions. Even if the investment’s value remains unchanged, fake price fluctuations can have a huge impact on the price chart. Technical analysis can be difficult to apply as a result of this. Fortunately, any price influence from outside sources may be handled quickly. Changing the historical data before the price change is all it takes. As a result, you’ll need to double-check that your broker follows these guidelines.
Tips to Started Trading with Stock Market Technical Analysis
This section covers useful stock market tips that can help you get the most out of your technical analyst and avoid making costly beginner mistakes.
Selecting a Broker with Good Stock Market Analysis Tools
The trading and analysis platform is a daily tool for a trader that uses stock market technical analysis. It is the online broker that supplies the charts as well as the ability to place and plan trading orders. As a result, selecting a high-performance platform is critical. The first criterion is to see if the platform has the stocks and other assets that you are interested in.
You should also make sure that the platform is regulated, ideally in the UK. Above all, as a technical analyst, make sure your broker’s platform has all of the indications and tools you require. It’ll also be vital to make sure they’re conveniently accessible. The platform must be simple to use and free of extraneous complexity. This is to make sure that your investing decision-making technique is not affected.
Indicators should not be overloaded
With only a few graphic elements and two or three indicators, an excellent technical stock market analyst may be created. When you multiply analytical methods and indicators, you’ll get entirely illegible charts with no obvious trade indication. As a result, the signs and approaches used do not need to be multiplied. Limiting yourself to a few indicators and approaches also allows you to learn to trade quickly and easily while also ensuring that you have all you need to begin investing in the stock market right away.
Use two graphs with different horizons
Technical analysts typically utilize two charts with distinct time spans to evaluate a stock. The trader will use the broader chart to assess the overall movement. The shortest is used to identify trading signals and determine the best time to trade. A trader who spots indications on a one-hour chart, for example, will utilize a daily chart to assess the general trend.
This permits you to gain insight into the market’s direction beyond your local horizon. It is critical to take a position in the direction of the underlying trend. Look for buy indications on the short chart if the long chart’s trend is positive. Look for selling chances on the short chart if the long chart’s trend is negative.
Putting Your Technical Analysis Skills to Work in a Trading Strategy
You risk making major errors if you utilize a different technique for each study or if you are only focused on trading signals. A trading choice is separated into numerous steps, as we have explained in this tutorial. And each of these steps correlates to favored ways. Once you’ve mastered the fundamentals of stock market technical analysis, you’ll need to make sure you incorporate them into a well-thought-out trading strategy. Then you’ll have to stick to it every time you evaluate the market and take a position.
Test your strategies on a Demo Account
Most brokers, including eToro, provide free practice trading accounts. These accounts, which are credited with virtual money but are linked to genuine market conditions, allow you to practice in real-world scenarios without the fear of losing money.
You’ll be able to take your initial steps toward technical analysis of the stock market. On this occasion, you will be able to confirm that your analyses do, in fact, produce prudent indications in the majority of cases. Once the results in the demo account are correct, you can apply the trading plan that you refined in the demo account to actual trading.
Conclusion
In conclusion, stock market technical analysis is a must-have for all stock traders. It is a simple and rapid way of market analysis. It also produces excellent outcomes, but it does not ensure success. There are many different types of technical analyses for the stock market, and we’ve explored some of the most interesting in this tutorial.
To get started, sign up for a free account with an online broker in seconds to have access to free stock market technical analysis tools and learn how to use them in real-time.
We recommend eToro as a broker for this, as it has a particularly effective stock market technical analysis tool. eToro is very easy to use, so it’s appropriate for both beginners and professionals. Furthermore, eToro allows you to invest in the stock market for free, and you can buy shares with cash or CFDs.
Frequently asked Questions
What is the Advantage of Stock Market Technical Analysis?
Traders appreciate technical analysis in the stock market because of the results it produces. Stock market technical analysis, when used correctly, can significantly improve the performance of your trading. Of course, nothing is certain. It is possible that even the most thorough technical research can lead to a lost trading decision. Another big benefit of stock market technical analysis is that, as we’ve seen in this article, it’s quite simple and quick to master.
What is the best stock market technical analysis broker?
We’ve shown in this article that the eToro is the best stock market technical analysis broker. There will be reduced fees, including no commission on shares, in addition to the technical analysis platform itself. Alternatively, you could trade stocks in CFDs or cash. When it comes to the platform, it has all of the necessary tools, indications, and features for advanced technical analysis. It is, nevertheless, incredibly simple to work with.
Is Stock Market Technical Analysis Good for Short-Term or Long-Term Trading?
Fundamental analysis is more appropriate for stocks in the long run than technical analysis. Even if you have a long-term investment horizon, it is still beneficial to learn about the fundamental technical environment, such as the fund trend or the important long-term thresholds to watch. Technical analysis, on the other hand, is critical for all traders in the near term.
What is the major drawback of Stock market Technical Analysis?
The biggest issue in technical analysis is that it ignores fundamental data. These can sometimes override technical factors, invalidating technical studies. As a result, all technical analysts should stay up to date on relevant information, statements, figures, and publications. This is done to detect elements that may obstruct their technical analyses.
Is Technical Analysis of the Stock Market Reliable?
With stock market technical analysis, certainty is impossible to achieve. Stock market technical analysis, when used correctly, can considerably increase your trading outcomes and success rate.